Brazil EMBI directed graphs
Monthly — is the current spread priced?
very rich
Brazil EMBI looks very rich at 161 bp vs fair 199 bp (-38 bp / -2.5σ tight).
The EMBI tightened 25 bp over the last 6 months (197 → 171 bp). Last month it tightened another 3 bp. Last month’s move was led by US high-yield spreads (+9 bp, wider); USD broad (+5 bp, wider); the terms-of-trade gap (+2 bp, wider). It looks very rich because the market print (161 bp) is tighter than macro fair value (199 bp, gap -38 bp).
- US high-yield spreads widened, which put downward pressure on the REER gap vs trend, which typically widens the EMBI spread. That does not appear to have been incorporated into the current spread.
- USD broad increased, which put downward pressure on the real exchange rate (REER), which typically widens the EMBI spread. That does not appear to have been incorporated into the current spread.
- US 10Y yields increased, which put upward pressure on the Selic, which typically widens the EMBI spread. That does not appear to have been incorporated into the current spread.
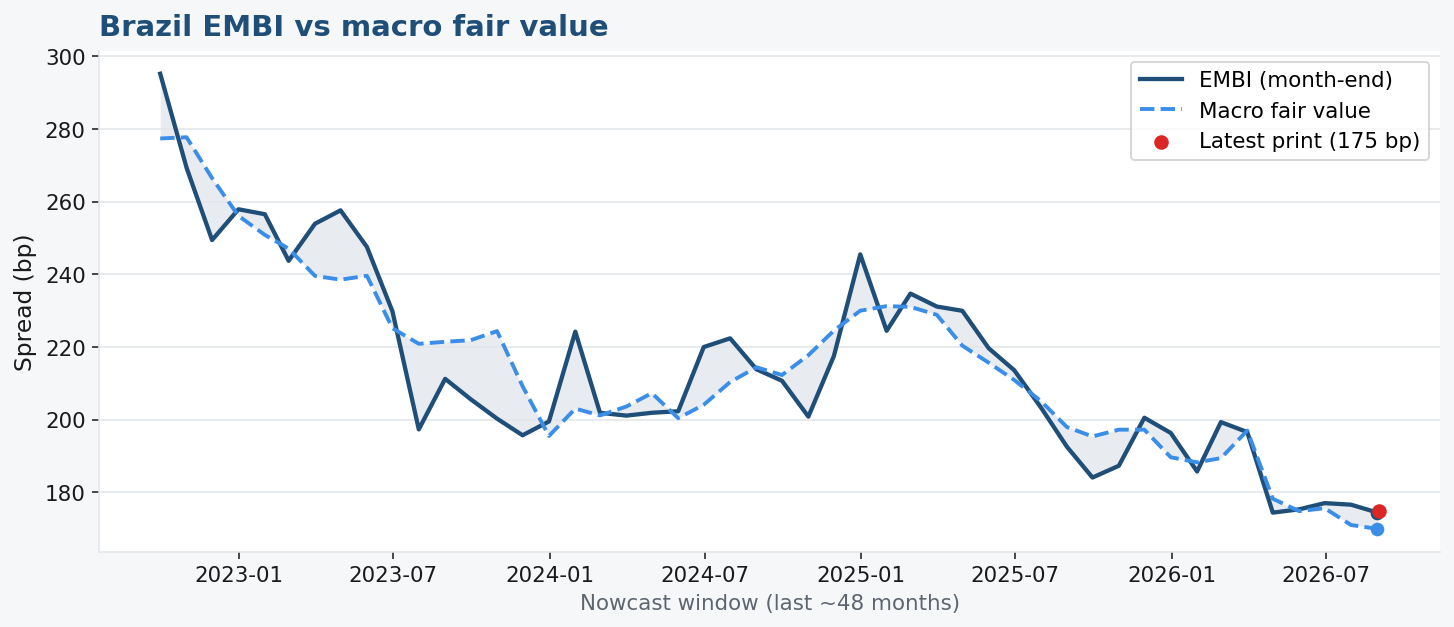
| Current EMBI | 161 bp (2026-10-15) |
|---|---|
| Macro fair value | 199 bp (month-end 2026-09-30) |
| Rich / cheap | very_rich |
| Gap (current − fair) | -38 bp (-2.523σ) |
| Month-end residual | -28 bp |
| Residual σ | 15 bp |
| In-sample R² | 0.689 |
4 monthly print(s) may not yet have been tradable at the last EMBI date.
| Parent | Δ last month | Contrib bp | Typical print lag (d) |
|---|---|---|---|
| us_hy_oas (t) | 0.490 | +8.6 | 0 |
| dxy (t) | 2.401 | +4.8 | 0 |
| tot_gap (t) | 0.000 | +2.4 | 45 |
| tot (t) | 0.000 | +0.0 | 45 |
| debt_gap (t) | 0.000 | +0.0 | 35 |
| current_account (t) | 0.000 | +0.0 | 25 |
Has EMBI had time to trade the prints?
| Input | Est. release | Traded after print? | Days since |
|---|---|---|---|
| us_hy_oas | 2026-09-30 | yes | 15 |
| tot | 2026-11-14 | pending | -30 |
| tot_gap | 2026-11-14 | pending | -30 |
| dxy | 2026-09-30 | yes | 15 |
| debt_gap | 2026-11-04 | pending | -20 |
| current_account | 2026-10-25 | pending | -10 |
Monthly DAG
Narrative edges (strongest first)
| From | To | Lag | β (z) | Child R² | |
|---|---|---|---|---|---|
| public_debt_gdp | → | debt_gap | t | +1.000 | 0.279 |
| fx | → | reer | t | -0.948 | -7.641 |
| nominal_deficit | → | primary_balance | t | +0.948 | 0.534 |
| dxy | → | fx | t | +0.916 | -18.328 |
| sp500 | → | equity | t | +0.898 | 0.072 |
| selic | → | policy_fed_gap | t | +0.886 | 0.495 |
| dxy | → | reer | t | -0.839 | -7.641 |
| fx | → | equity | t | +0.814 | 0.072 |
| debt_gap | → | policy_fed_gap | t | -0.765 | 0.495 |
| us_hy_oas | → | equity | t | -0.705 | 0.072 |
| fed_funds | → | equity | t | +0.699 | 0.072 |
| reer | → | equity | t | -0.677 | 0.072 |
| tot_gap | → | current_account | t | +0.671 | 0.186 |
| primary_balance | → | debt_gap | t | -0.669 | 0.279 |
| primary_balance | → | public_debt_gdp | t | -0.669 | -46.580 |
| tot_gap | → | primary_balance | t | -0.633 | 0.534 |
| debt_gap | → | selic | t | -0.622 | -0.113 |
| public_debt_gdp | → | selic | t | -0.622 | -0.113 |
| oil | → | embi_bra | t | -0.621 | -2.143 |
| cpi | → | policy_fed_gap | t | +0.616 | 0.495 |
| equity | → | policy_fed_gap | t | -0.599 | 0.495 |
| current_account | → | equity | t | +0.595 | 0.072 |
| nominal_deficit | → | public_debt_gdp | t | -0.593 | -46.580 |
| primary_balance | → | selic | t | +0.591 | -0.113 |
| reer_gap | → | embi_bra | t | -0.579 | -2.143 |
| copper | → | tot | t | +0.574 | -30061.986 |
| tot_gap | → | equity | t | +0.567 | 0.072 |
| us_hy_oas | → | fx | t | -0.563 | -18.328 |
| exports_growth | → | current_account | t | +0.542 | 0.186 |
| copper | → | embi_bra | t | -0.514 | -2.143 |
| copper | → | equity | t | +0.512 | 0.072 |
| current_account | → | fx | t | +0.510 | -18.328 |
| oil | → | tot | t | +0.505 | -30061.986 |
| ust_short | → | selic | t | +0.495 | -0.113 |
| tot | → | embi_bra | t | -0.488 | -2.143 |
| reer | → | embi_bra | t | -0.484 | -2.143 |
| copper | → | exports_growth | t | +0.475 | -0.002 |
| global_sentiment | → | equity | t | +0.465 | 0.072 |
| us_hy_oas | → | reer | t | +0.459 | -7.641 |
| cpi | → | selic | t | +0.455 | -0.113 |
| nominal_deficit | → | selic | t | +0.455 | -0.113 |
| oil | → | reer | t | +0.454 | -7.641 |
| fx | → | policy_fed_gap | t | -0.447 | 0.495 |
| reer | → | policy_fed_gap | t | +0.445 | 0.495 |
| tot_gap | → | fx | t | +0.440 | -18.328 |
| tot | → | exports_growth | t | +0.430 | -0.002 |
| tot | → | primary_balance | t | -0.429 | 0.534 |
| tot_gap | → | reer | t | -0.428 | -7.641 |
| sp500 | → | policy_fed_gap | t | -0.418 | 0.495 |
| tot | → | current_account | t | +0.416 | 0.186 |
| reer | → | reer_gap | t | +0.416 | -0.096 |
| us_hy_oas | → | reer_gap | t | -0.415 | -0.096 |
| dxy | → | embi_bra | t | +0.411 | -2.143 |
| us_hy_oas | → | policy_fed_gap | t | +0.406 | 0.495 |
| tot | → | reserves | t | -0.404 | -493.559 |
| reer_gap | → | selic | t | +0.397 | -0.113 |
| oil | → | fx | t | -0.392 | -18.328 |
| copper | → | tot_gap | t | +0.384 | -24.901 |
| reserves_growth | → | embi_bra | t | -0.357 | -2.143 |
| fx | → | embi_bra | t | +0.351 | -2.143 |
ΔEMBI engine (holdout score)
Ridge on ΔEMBI: 1 risk (HY or VIX or S&P) + 1 rates/USD + 1 commodity + 1 local + 1 stock. Ranked by holdout R², not quintile lift. Best: theory|lags=[1] · parents: us_hy_oas, dxy, oil, equity, reer_gap · 182 train / 20 test through 2026-10-31.
| From | To | Lag | β (z) | Child R² | |
|---|---|---|---|---|---|
| us_hy_oas | → | embi_bra | t−1 | -0.124 | -0.002 |
| equity | → | embi_bra | t−1 | -0.084 | -0.002 |
| dxy | → | embi_bra | t−1 | +0.040 | -0.002 |
| reer_gap | → | embi_bra | t−1 | +0.034 | -0.002 |
| oil | → | embi_bra | t−1 | -0.005 | -0.002 |
| Method | Lags | OOS R² | σ-quintile | Lift vs naive | Naive middle | ±1 bin | 3-class | Sign | RMSE Δ | Edges | Parents |
|---|---|---|---|---|---|---|---|---|---|---|---|
| theory|lags=[1] ← best | [1] | -0.790 | 40.0% | -0.150 | 55.0% | 85.0% | 40.0% | 60.0% | 0.108 | 22 | 5 |
| pc|lags=[1] | [1] | -0.790 | 40.0% | -0.150 | 55.0% | 85.0% | 40.0% | 60.0% | 0.108 | 52 | 5 |
| pc_strict|lags=[1] | [1] | -0.790 | 40.0% | -0.150 | 55.0% | 85.0% | 40.0% | 60.0% | 0.108 | 45 | 5 |
| tan|lags=[1] | [1] | -0.790 | 40.0% | -0.150 | 55.0% | 85.0% | 40.0% | 60.0% | 0.108 | 15 | 5 |
| hybrid|lags=[1] | [1] | -0.790 | 40.0% | -0.150 | 55.0% | 85.0% | 40.0% | 60.0% | 0.108 | 50 | 5 |
| theory|lags=[1, 2] | [1, 2] | -0.848 | 50.0% | -0.050 | 55.0% | 90.0% | 50.0% | 60.0% | 0.110 | 22 | 10 |
| pc|lags=[1, 2] | [1, 2] | -0.848 | 50.0% | -0.050 | 55.0% | 90.0% | 50.0% | 60.0% | 0.110 | 52 | 10 |
| pc_strict|lags=[1, 2] | [1, 2] | -0.848 | 50.0% | -0.050 | 55.0% | 90.0% | 50.0% | 60.0% | 0.110 | 45 | 10 |
| tan|lags=[1, 2] | [1, 2] | -0.848 | 50.0% | -0.050 | 55.0% | 90.0% | 50.0% | 60.0% | 0.110 | 15 | 10 |
| hybrid|lags=[1, 2] | [1, 2] | -0.848 | 50.0% | -0.050 | 55.0% | 90.0% | 50.0% | 60.0% | 0.110 | 50 | 10 |
| theory|lags=[1, 3] | [1, 3] | -1.199 | 35.0% | -0.200 | 55.0% | 90.0% | 35.0% | 65.0% | 0.120 | 22 | 10 |
| pc|lags=[1, 3] | [1, 3] | -1.199 | 35.0% | -0.200 | 55.0% | 90.0% | 35.0% | 65.0% | 0.120 | 52 | 10 |
| pc_strict|lags=[1, 3] | [1, 3] | -1.199 | 35.0% | -0.200 | 55.0% | 90.0% | 35.0% | 65.0% | 0.120 | 45 | 10 |
| tan|lags=[1, 3] | [1, 3] | -1.199 | 35.0% | -0.200 | 55.0% | 90.0% | 35.0% | 65.0% | 0.120 | 15 | 10 |