Colombia EMBI directed graphs
Monthly — is the current spread priced?
rich
Colombia EMBI looks rich at 217 bp vs fair 254 bp (-37 bp tight).
The EMBI tightened 56 bp over the last 6 months (282 → 226 bp). Last month it widened another 37 bp. Last month’s move was led by US high-yield spreads (+27 bp, wider); USD broad (+7 bp, wider). It looks rich because the market print (217 bp) is tighter than macro fair value (254 bp, gap -37 bp).
- Fed funds increased, which put upward pressure on the local policy rate, which typically widens the EMBI spread. That does not appear to have been incorporated into the current spread.
- USD broad increased, which put upward pressure on the local exchange rate, which typically widens the EMBI spread. That does not appear to have been incorporated into the current spread.
- US 10Y yields increased, which put upward pressure on the local policy rate, which typically widens the EMBI spread. That does not appear to have been incorporated into the current spread.
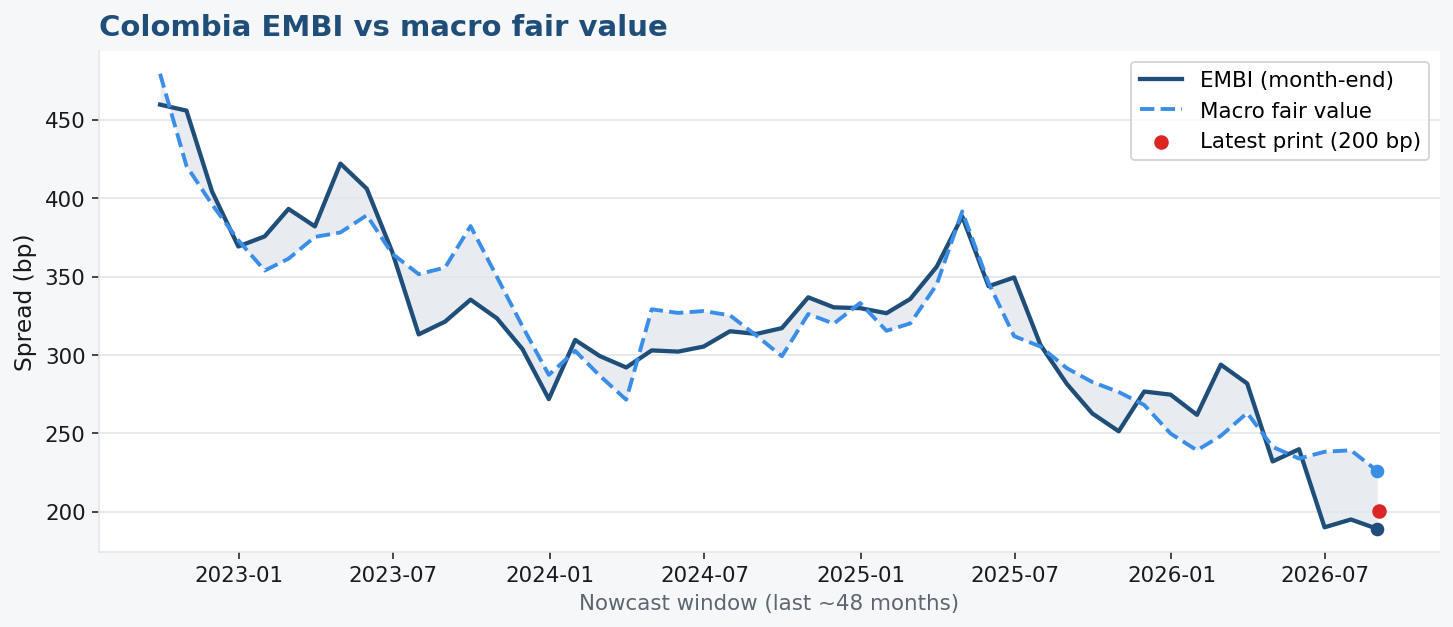
| Current EMBI | 217 bp (2026-10-15) |
|---|---|
| Macro fair value | 254 bp (month-end 2026-09-30) |
| Rich / cheap | rich |
| Gap (current − fair) | -37 bp (-1.477σ) |
| Month-end residual | -27 bp |
| Residual σ | 25 bp |
| In-sample R² | 0.841 |
4 monthly print(s) may not yet have been tradable at the last EMBI date.
| Parent | Δ last month | Contrib bp | Typical print lag (d) |
|---|---|---|---|
| us_hy_oas (t) | 0.490 | +27.2 | 0 |
| dxy (t) | 2.401 | +7.1 | 0 |
| tot_gap (t) | 0.000 | +0.1 | 45 |
| tot (t) | 0.000 | +0.0 | 45 |
| debt_gap (t) | 0.000 | +0.0 | 35 |
| current_account (t) | 0.000 | +0.0 | 25 |
Has EMBI had time to trade the prints?
| Input | Est. release | Traded after print? | Days since |
|---|---|---|---|
| us_hy_oas | 2026-09-30 | yes | 15 |
| tot | 2026-11-14 | pending | -30 |
| tot_gap | 2026-11-14 | pending | -30 |
| dxy | 2026-09-30 | yes | 15 |
| debt_gap | 2026-11-04 | pending | -20 |
| current_account | 2026-10-25 | pending | -10 |
Monthly DAG
Narrative edges (strongest first)
| From | To | Lag | β (z) | Child R² | |
|---|---|---|---|---|---|
| public_debt_gdp | → | debt_gap | t | +1.000 | 0.242 |
| nominal_deficit | → | primary_balance | t | +0.961 | 0.828 |
| dxy | → | fx | t | +0.942 | -1.222 |
| oil | → | tot | t | +0.942 | -1495.523 |
| fx | → | reer | t | -0.931 | -20.065 |
| reserves | → | fx | t | +0.893 | -1.222 |
| dxy | → | reer | t | -0.888 | -20.065 |
| policy_rate | → | policy_fed_gap | t | +0.882 | -5.442 |
| fed_funds | → | policy_rate | t | +0.865 | 0.817 |
| nominal_deficit | → | public_debt_gdp | t | -0.846 | -12.770 |
| cpi | → | policy_rate | t | +0.834 | 0.817 |
| fx | → | embi_bra | t | +0.825 | -3.083 |
| cpi | → | policy_fed_gap | t | +0.802 | -5.442 |
| copper | → | tot_gap | t | +0.776 | -51.057 |
| reer | → | embi_bra | t | -0.769 | -3.083 |
| dxy | → | embi_bra | t | +0.734 | -3.083 |
| primary_balance | → | debt_gap | t | -0.713 | 0.242 |
| primary_balance | → | public_debt_gdp | t | -0.713 | -12.770 |
| ust_short | → | policy_rate | t | +0.686 | 0.817 |
| copper | → | tot | t | +0.682 | -1495.523 |
| cpi | → | fx | t | +0.664 | -1.222 |
| oil | → | tot_gap | t | +0.617 | -51.057 |
| debt_gap | → | embi_bra | t | +0.596 | -3.083 |
| public_debt_gdp | → | embi_bra | t | +0.596 | -3.083 |
| tot | → | exports_growth | t | +0.588 | -2.530 |
| us_hy_oas | → | fx | t | -0.569 | -1.222 |
| policy_rate | → | embi_bra | t | +0.562 | -3.083 |
| copper | → | exports_growth | t | +0.561 | -2.530 |
| tot | → | reer_gap | t | +0.548 | -0.083 |
| fx | → | policy_rate | t | +0.546 | 0.817 |
| sp500 | → | policy_rate | t | +0.540 | 0.817 |
| dxy | → | policy_rate | t | +0.534 | 0.817 |
| tot | → | reer | t | +0.532 | -20.065 |
| fed_funds | → | policy_fed_gap | t | +0.526 | -5.442 |
| oil | → | reer | t | +0.517 | -20.065 |
| tot_gap | → | current_account | t | +0.514 | -0.704 |
| reer | → | reer_gap | t | +0.509 | -0.083 |
| oil | → | exports_growth | t | +0.507 | -2.530 |
| policy_fed_gap | → | embi_bra | t | +0.485 | -3.083 |
| ust_short | → | policy_fed_gap | t | +0.473 | -5.442 |
| reserves_growth | → | embi_bra | t | -0.470 | -3.083 |
| us_hy_oas | → | reer | t | +0.469 | -20.065 |
| tot | → | current_account | t | +0.447 | -0.704 |
| tot | → | reserves | t | -0.413 | -23.798 |
| exports_growth | → | current_account | t | +0.406 | -0.704 |
| reserves | → | reserves_growth | t | -0.406 | -0.030 |
| tot_gap | → | primary_balance | t | -0.398 | 0.828 |
| tot_gap | → | fx | t | +0.390 | -1.222 |
| oil | → | fx | t | -0.369 | -1.222 |
| tot | → | fx | t | -0.367 | -1.222 |
| us_hy_oas | → | policy_rate | t | -0.364 | 0.817 |
| oil | → | reserves | t | -0.343 | -23.798 |
| reer | → | policy_rate | t | -0.337 | 0.817 |
| vix | → | embi_bra | t | +0.323 | -3.083 |
| primary_balance | → | policy_rate | t | +0.311 | 0.817 |
| dxy | → | policy_fed_gap | t | +0.305 | -5.442 |
| fx | → | policy_fed_gap | t | +0.304 | -5.442 |
| reer_gap | → | policy_rate | t | +0.298 | 0.817 |
| current_account | → | embi_bra | t | -0.283 | -3.083 |
| us_hy_oas | → | reer_gap | t | -0.275 | -0.083 |
ΔEMBI engine (holdout score)
Ridge on ΔEMBI: 1 risk (HY or VIX or S&P) + 1 rates/USD + 1 commodity + 1 local + 1 stock. Ranked by holdout R², not quintile lift. Best: theory|lags=[0, 1] · parents: vix, dxy, oil, fx, public_debt_gdp · 182 train / 20 test through 2026-10-31.
| From | To | Lag | β (z) | Child R² | |
|---|---|---|---|---|---|
| vix | → | embi_bra | t | +0.282 | 0.562 |
| dxy | → | embi_bra | t | +0.239 | 0.562 |
| vix | → | embi_bra | t−1 | +0.178 | 0.562 |
| fx | → | embi_bra | t | +0.146 | 0.562 |
| fx | → | embi_bra | t−1 | +0.077 | 0.562 |
| oil | → | embi_bra | t | -0.055 | 0.562 |
| dxy | → | embi_bra | t−1 | -0.054 | 0.562 |
| oil | → | embi_bra | t−1 | -0.014 | 0.562 |
| public_debt_gdp | → | embi_bra | t−1 | -0.000 | 0.562 |
| public_debt_gdp | → | embi_bra | t | +0.000 | 0.562 |
| Method | Lags | OOS R² | σ-quintile | Lift vs naive | Naive middle | ±1 bin | 3-class | Sign | RMSE Δ | Edges | Parents |
|---|---|---|---|---|---|---|---|---|---|---|---|
| theory|lags=[0, 1] ← best | [0, 1] | 0.004 | 15.0% | -0.200 | 35.0% | 85.0% | 25.0% | 55.0% | 0.266 | 20 | 10 |
| pc|lags=[0, 1] | [0, 1] | 0.004 | 15.0% | -0.200 | 35.0% | 85.0% | 25.0% | 55.0% | 0.266 | 44 | 10 |
| pc_strict|lags=[0, 1] | [0, 1] | 0.004 | 15.0% | -0.200 | 35.0% | 85.0% | 25.0% | 55.0% | 0.266 | 36 | 10 |
| tan|lags=[0, 1] | [0, 1] | 0.004 | 15.0% | -0.200 | 35.0% | 85.0% | 25.0% | 55.0% | 0.266 | 13 | 10 |
| hybrid|lags=[0, 1] | [0, 1] | 0.004 | 15.0% | -0.200 | 35.0% | 85.0% | 25.0% | 55.0% | 0.266 | 37 | 10 |
| theory|lags=[0] | [0] | -0.009 | 35.0% | 0.000 | 35.0% | 90.0% | 50.0% | 55.0% | 0.268 | 20 | 5 |
| pc|lags=[0] | [0] | -0.009 | 35.0% | 0.000 | 35.0% | 90.0% | 50.0% | 55.0% | 0.268 | 44 | 5 |
| pc_strict|lags=[0] | [0] | -0.009 | 35.0% | 0.000 | 35.0% | 90.0% | 50.0% | 55.0% | 0.268 | 36 | 5 |
| tan|lags=[0] | [0] | -0.009 | 35.0% | 0.000 | 35.0% | 90.0% | 50.0% | 55.0% | 0.268 | 13 | 5 |
| hybrid|lags=[0] | [0] | -0.009 | 35.0% | 0.000 | 35.0% | 90.0% | 50.0% | 55.0% | 0.268 | 37 | 5 |
| theory|lags=[0, 1, 2] | [0, 1, 2] | -0.028 | 15.0% | -0.200 | 35.0% | 85.0% | 25.0% | 50.0% | 0.271 | 20 | 15 |
| pc|lags=[0, 1, 2] | [0, 1, 2] | -0.028 | 15.0% | -0.200 | 35.0% | 85.0% | 25.0% | 50.0% | 0.271 | 44 | 15 |
| pc_strict|lags=[0, 1, 2] | [0, 1, 2] | -0.028 | 15.0% | -0.200 | 35.0% | 85.0% | 25.0% | 50.0% | 0.271 | 36 | 15 |
| tan|lags=[0, 1, 2] | [0, 1, 2] | -0.028 | 15.0% | -0.200 | 35.0% | 85.0% | 25.0% | 50.0% | 0.271 | 13 | 15 |