CHL · Investment Grade
Chile
Last EMBI
95 bp
2026-10-15
Valuation graph
Rich
Chile EMBI looks rich at 95 bp vs fair 100 bp (-5 bp tight).
News themes
Upcoming releases
| Date | Name | Release | |
|---|---|---|---|
| 2026-10-27 | CB | Chile | BCCh TPM |
| 2026-11-09 | CPI | Chile | IPC |
| 2026-12-08 | CPI | Chile | IPC |
| 2026-12-15 | CB | Chile | BCCh TPM |
Valuation graph
rich
The EMBI tightened 6 bp over the last 6 months (102 → 96 bp). Last month it widened another 9 bp. Last month’s move was led by US high-yield spreads (+11 bp, wider); USD broad (+6 bp, wider).
It looks rich because the market print (95 bp) is tighter than macro fair value (100 bp, gap -5 bp).
- US high-yield spreads widened, which put downward pressure on the REER gap vs trend, which typically widens the EMBI spread. That does not appear to have been incorporated into the current spread.
- The local exchange rate increased, which put downward pressure on the real exchange rate (REER), which typically widens the EMBI spread. That does not appear to have been incorporated into the current spread.
- USD broad increased, which put downward pressure on the real exchange rate (REER), which typically widens the EMBI spread. That does not appear to have been incorporated into the current spread.
Algorithm
Expert causal graph (no search). Edges are the whitelist of allowed contemporaneous channels; the picture is that graph after lag scoring.
- This name: theory (theory|lags=[0, 1, 2]), ΔEMBI lags t, t−1, t−2.
- Train 182 months · holdout 20 · sample from 2010-01-01.
- Fair value is a separate 48-month level OLS nowcast on the displayed parents (not the TAN classifier).
Rules — all DAGs
- Causal tiers (top → bottom): 0 Global macro; 1 ToT / activity; 2 Fiscal; 3 Monetary; 4 Trade / FX; 5 Local markets; 6 Local news; 7 EMBI / equity.
- Locals cannot point at globals. Same-tier arrows only if listed in the expert contemporaneous set.
- Dropped as parents: leaky composites (global_embi, latam_embi); local GDELT mass (debt_theme, election_shock, election_theme, local_sentiment, whitelist_sentiment).
- At most five parents per node after search. EMBI is the sink.
- Display always keeps last hops into equity, policy_fed_gap so the picture matches the valuation prose.
- Global 2020Q1–Q2 crisis months are down-weighted in the loss.
Rules — Chile
- Debt gap is public debt/GDP minus a 45% ‘healthy’ level.
Node transformations
- Monthly last-observation of daily markets; official-month macros as published.
- Structure/strengths on z-scored levels; ΔEMBI equation uses the selected lag set.
- Gaps: ToT and REER vs trend; debt vs the healthy debt/GDP above; policy rate minus Fed funds.
- Winsorized residuals; Huber-style weights; publication-lag notes so unprinted macros are not treated as traded.
- Fair-value nowcast: 48-month window, standardized OLS, mapped back to basis points.
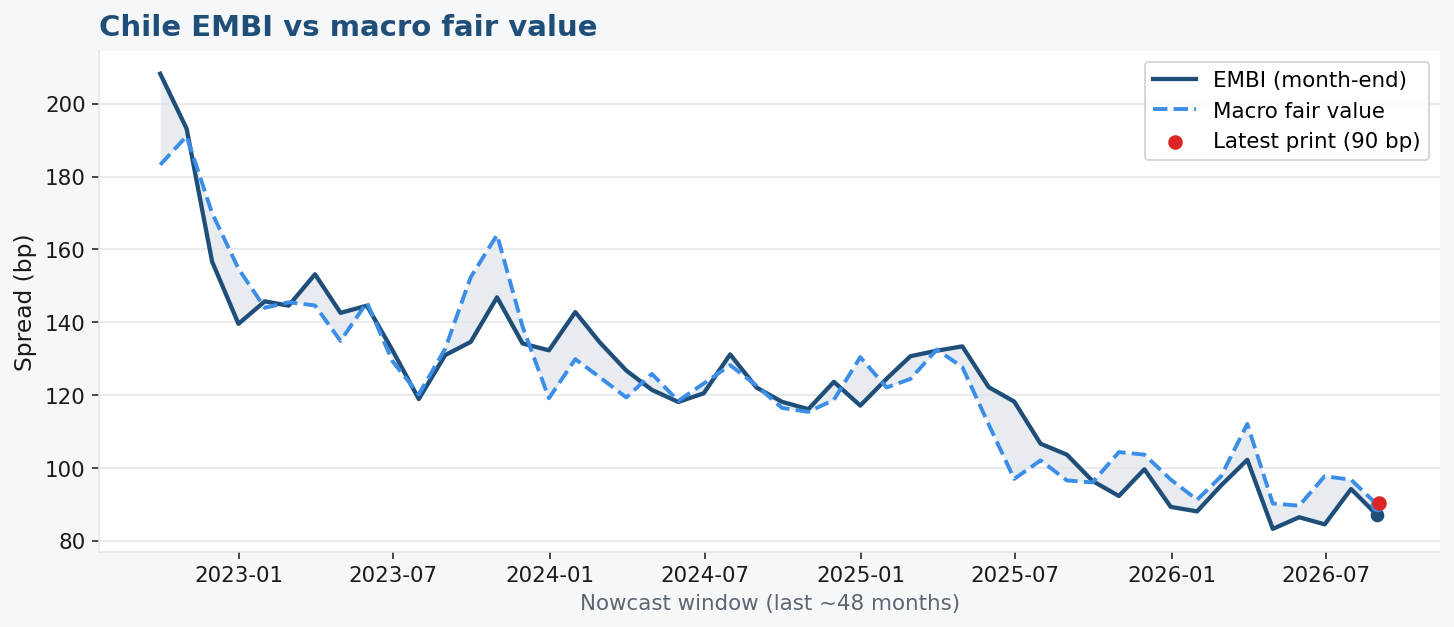
| Current EMBI | 95 bp |
|---|---|
| Macro fair value | 100 bp |
| Gap (current − fair) | -5 bp (-0.6σ) |
4 monthly print(s) may not yet have been tradable at the last EMBI date.